Pikes Peak Area Real Estate Stats for January
January 2024 real estate in the Pikes Peak area has encouraged many buyers and sellers to reengage their plans to move. Compare activity in Pike Peak area to the nationwide average and you will see that we are generally following the trend lines. Listing Count February '23 2,075 and January 2024 is at 2,154 Pending Listing Count Feb '23 at 688 Jan '24 at 620 Median Listing Price Feb '23 $513K Jan '24 at $510 Median DOM Feb '23 at 53 Jan '24 at 71 Months of Inventory 2.6 which is below a balanced market supply of 6 months inventory Top Realtor, Marquesa Hobbs, is ready to help you plan for 2024! cell 719.238.0330 office 719.536.4444 Marquesa@ColoradoHearthstone.com 6760 Corporate Drive, Ste. 300 | Colorado Springs, CO 80919
What’s Really Happening with Mortgage Rates?
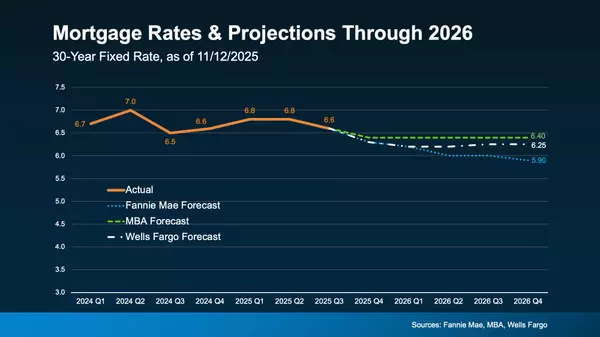
Are you feeling a bit unsure about what’s really happening with mortgage rates? That might be because you’ve heard someone say they’re coming down. But then you read somewhere else that they’re up again. And that may leave you scratching your head and wondering what’s true. The simplest answer is: that what you read or hear will vary based on the time frame they’re looking at. Here’s some information that can help clear up the confusion. Mortgage Rates Are Volatile by Nature Mortgage rates don’t move in a straight line. There are too many factors at play for that to happen. Instead, rates bounce around because they’re impacted by things like economic conditions, decisions from the Federal Reserve, and so much more. That means they might be up one day and down the next depending on what’s going on in the economy and the world as a whole. Take a look at the graph below. It uses data from Mortgage News Daily to show the ebbs and flows in the 30-year fixed mortgage rate since last October: If you look at the graph, you’ll see a lot of peaks and valleys – some bigger than others. And when you use data like this to explain what’s happening, the story can be different based on which two points in the graph you’re comparing. For example, if you’re only looking at the beginning of this month through now, you may think mortgage rates are on the way back up. But, if you look at the latest data point and compare it to the peak in October, rates have trended down. So, what’s the right way to look at it? The Big Picture Mortgage rates are always going to bounce around. It’s just how they work. So, you shouldn’t focus too much on the small, daily changes. Instead, to really understand the overall trend, zoom out and look at the big picture. When you look at the highest point (October) compared to where rates are now, you can see they’ve come down compared to last year. And if you’re looking to buy a home, this is big news. Don’t let the little blips distract you. The experts agree, overall, that the larger downward trend could continue this year. Bottom Line Let’s connect if you have any questions about what you’re reading or hearing about the housing market. Top Realtor, Marquesa Hobbs, is ready to help you plan for 2024! cell 719.238.0330 office 719.536.4444 Marquesa@ColoradoHearthstone.com 6760 Corporate Drive, Ste. 300 | Colorado Springs, CO 80919
Don’t Let the Latest Home Price Headlines Confuse You
Based on what you’re hearing in the news about home prices, you may be worried they’re falling. But here’s the thing. The headlines aren’t giving you the full picture. If you look at the national data for 2023, home prices actually showed positive growth for the year. While this varies by market, and while there were some months with slight declines nationally, those were the exception, not the rule. The overarching story is that prices went up last year, not down. Let’s dive into the data to set the record straight. 2023 Was the Return to More Normal Home Price Growth If anything, last year marked a return to more normal home price appreciation. To prove it, here’s what usually happens in residential real estate. In the housing market, there are predictable ebbs and flows that take place each year. It’s called seasonality. It goes like this. Spring is the peak homebuying season when the market is most active. That activity is usually still strong in the summer, but begins to wane toward the end of the year. Home prices follow along with this seasonality because prices grow the most when there’s high demand. The graph below uses data from Case-Shiller to show how this pattern played out in home prices from 1973 through 2022 (not adjusted, so you can see the seasonality): As the data shows, for nearly 50 years, home prices match typical market seasonality. At the beginning of the year, home prices grow more moderately. That’s because the market is less active as fewer people move in January and February. Then, as the market transitions into the peak homebuying season in the spring, activity ramps up. That means home prices do too. Then, as fall and winter approach, activity eases again and prices grow, just at a slower rate. Now, let’s layer the data that’s come out for 2023 so far (shown in green) on top of that long-term trend (still shown in blue). That way, it’s easy to see how 2023 compares. As the graph shows, moving through the year in 2023, the level of appreciation fell more in line with the long-term trend for what usually happens in the housing market. You can see that in how close the green bars come to matching the blue bars in the later part of the year. But the headlines only really focused on the two bars outlined in red. Here’s the context you may not have gotten that can really put those two bars into perspective. The long-term trend shows it’s normal for home prices to moderate in the fall and winter. That’s typical seasonality. And since the 49-year average is so close to zero during those months (0.10%), that also means it’s not unusual for home prices to drop ever so slightly during those times. But those are just blips on the radar. If you look at the year as a whole, home prices still rose overall. What You Really Need To Know Headlines are going to call attention to the small month-to-month dips instead of the bigger year-long picture. And that can be a bit misleading because it’s only focused on one part of the whole story. Instead, remember last year we saw the return of seasonality in the housing market – and that’s a good thing after home prices skyrocketed unsustainably during the ‘unicorn’ years of the pandemic. And just in case you’re still worried home prices will fall, don’t be. The expectation for this year is that prices will continue to appreciate as buyers re-enter the market due to mortgage rates trending down compared to last year. As buyer demand goes up and more people move at the same time the supply of homes for sale is still low, the upward pressure on prices will continue. Bottom Line Don’t let home price headlines confuse you. The data shows that, as a whole, home prices rose in 2023. If you have questions about what you’re hearing in the news or about what’s happening with home prices in our local area, let’s connect. Top Realtor, Marquesa Hobbs, is ready to help you plan for 2024! cell 719.238.0330 office 719.536.4444 Marquesa@ColoradoHearthstone.com 6760 Corporate Drive, Ste. 300 | Colorado Springs, CO 80919
Categories
Recent Posts